In this activity, you will learn about a natural factor affecting our everyday lives: daylight.
Activity: Investigating Daylight
First let us discuss about daylight. Think about the following:
•Do you know approximately when the sun will set today?
•Do you know when the sun rose today?
•How will this be different from now in six months?
•What determines the amount of daylight we have each day?
•If the earth turns all the way around every 24 hours, then why are some days longer than others?
•How is this related to the seasons?
Summary of the Activity
In Step 1 of this activity, you will look at actual sunrise and sunset times of Delhi to determine a pattern in the amount of daylight. You will collect your data in Excel and create a chart to help you identify the pattern. You will then write an explanation of why you think the amount of daylight varies throughout the year.
In Step 2 you will work to understand why there is a pattern in the amount of daylight over the course of the year. For example, if the earth always turns one rotation every 24 hours, then why does the amount of daylight vary? You will view an online demonstration that explains this and then write an explanation in your own words.
Step 1: Research
• What to do
1. Collect and chart sunrise and sunset times for Delhi over a period of one year. Fortunately, there is a Web site where you can get the sunrise and sunset times so you don't have to wait a year to collect the information.
2. Open Internet Explorer and go to this Web site: http://aa.usno.navy.mil/data/docs/RS_OneDay.html
3. Open an Excel spreadsheet and, using the data from the Web site, record the sunrise and sunset data for the first day of each month for one year.
Notes
• When entering the time, be sure to use this format: 7:05 AM, 5:08 PM.
• The amount of daylight will automatically be calculated for you in column D
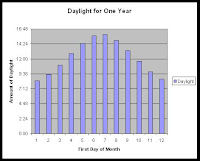
4. Using Excel, create a bar chart of the daylight in column D when you have finished entering the data.
5. Now open a Word document and, in your own words, explain the pattern you see for the daylight data. Include why you think this pattern occurs. Be sure your finished Word document includes your data, chart, and written explanation.
Step 2: Analyze and interpret your data
• What to do
1. In the Word document you saved in Step 1, write notes that explore the following questions in as much detail as possible:
• What is the pattern for the amount of daylight during the course of a year?
• Why do some days have more daylight than others?
• What roles do the earth and sun play in determining the amount of daylight?
• What is the daylight pattern for the North Pole?
• What is the daylight pattern for the South Pole?
• What is the daylight pattern for a location near the equator?
2. Open Internet Explorer and go to this Web site: http://www.amnh.org/education/resources/rfl/web/antarctica/seasonal.html
3. View the online demonstration and read the information on the Web site.
4. Now that you have seen the online demonstration, go back to your Word document, review the notes you previously made regarding the six questions above, and revise them if necessary. Be sure to write your answers in complete sentences.
Assessment
• For Step 1, students will be assessed on the accuracy of their data collection and creation of a chart from their data. You should use accurate scientific and mathematical terms when describing the pattern they see.
• For Step 2, you will be assessed on the responses to the questions after viewing the online demonstration.


No comments:
Post a Comment